Binance’s weekly trading volume reached US$24 billion in January this year, accounting for 49% of the total global USDC trading volume.
Author:The Kaiko Research Team
As North America quickly resolved tariff disputes, global markets gradually returned to stability. At the same time, the United States is actively exploring the establishment of its own sovereign wealth fund, while David Sacks, a regulator in the cryptocurrency field, is optimistic that digital assets are about to usher in a golden age.
This week, we will discuss in depth the following aspects:
-
Coinbase’s market performance before earnings release
-
USDC’s trading volume on Binance platform has increased significantly
-
Liquidity trend in shanzhai market
How encrypted data can become a key tool for predicting earnings performance
Coinbase earnings outlook: Market data provides early insights
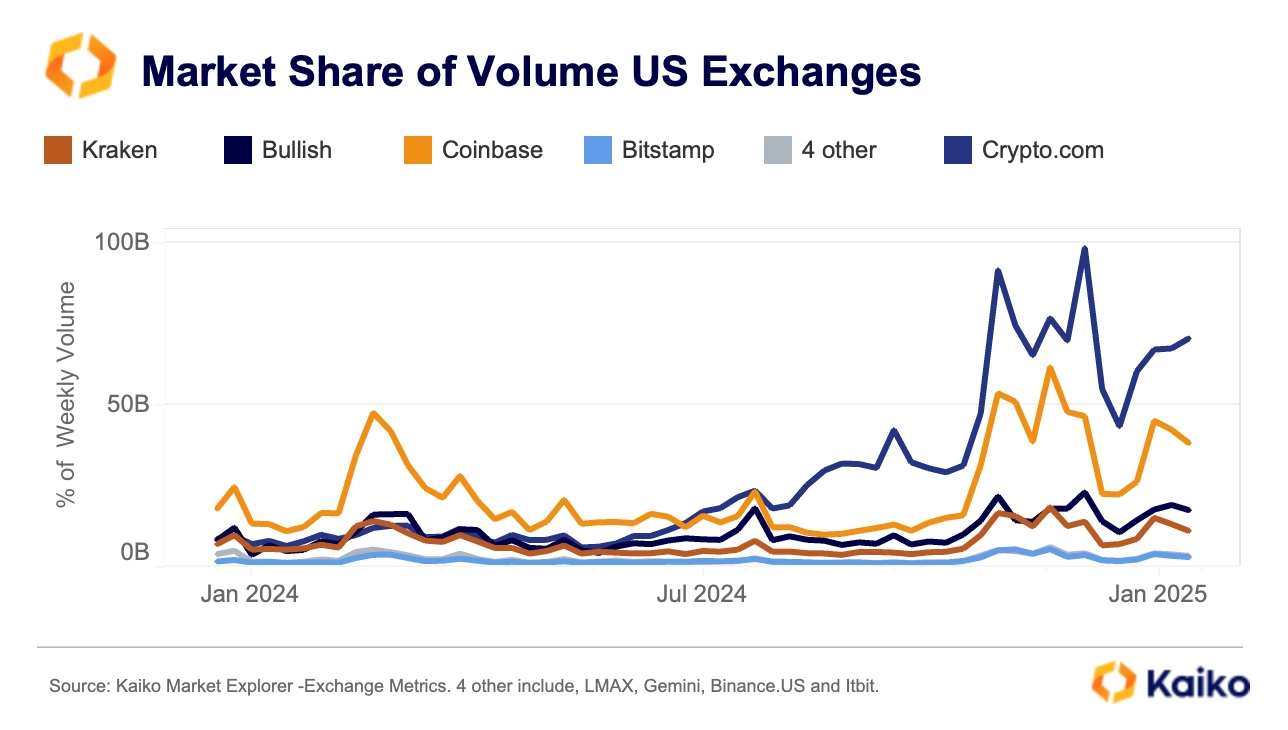
Coinbase will release its fourth-quarter 2024 financial results on Thursday (February 13). Prior to this, by analyzing market data, we can get preliminary clues about its performance. Although analysts ‘earnings expectations and prospects can have a direct impact on stock prices, crypto market data is often an important leading indicator of the health of exchanges.
Data showed that Coinbase’s weekly trading volume climbed to its highest level in two years in the fourth quarter. This trend shows that the platform has benefited a lot from the post-election market rebound.
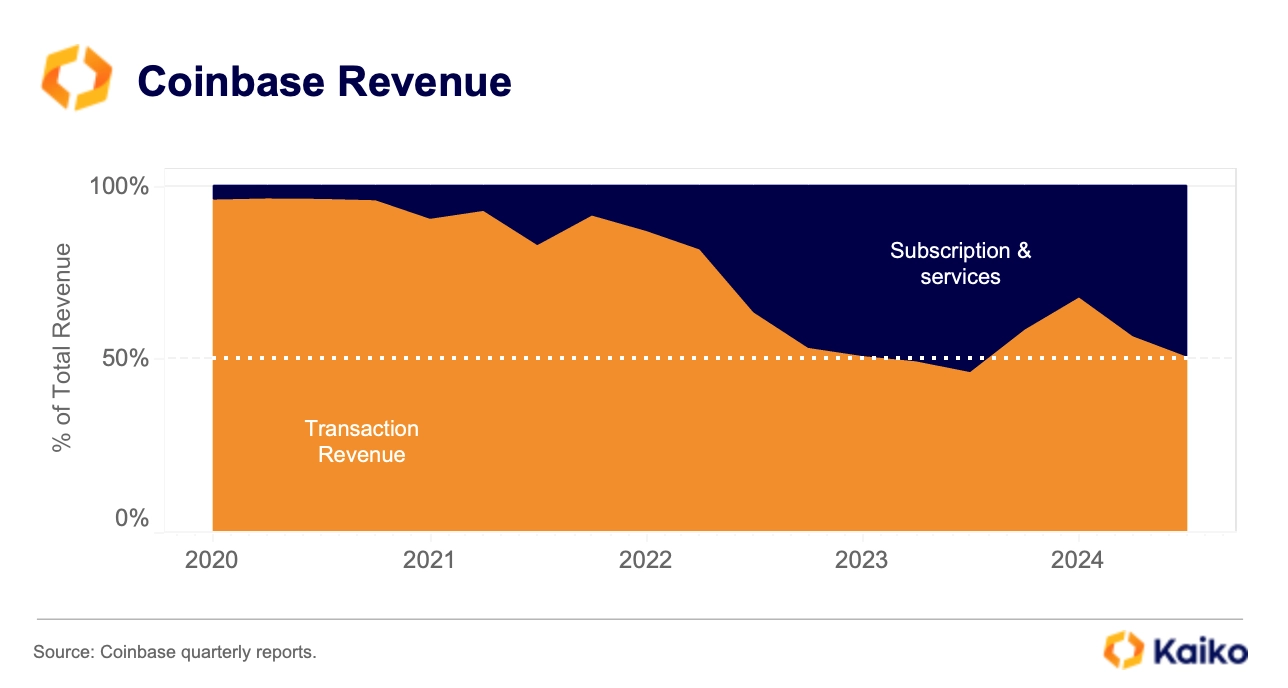
In recent years, Coinbase’s revenue sources have gradually diversified, with its subscription and service businesses (including pledge rewards, custody fees and USDC interest) accounting for a significant increase in total revenue.
However, transaction revenue remains Coinbase’s core business. Except for one quarter in 2023, transaction revenue always accounts for more than 50% of total revenue.
It should be noted that subscription and service revenue is closely related to the overall activity of the crypto market and does not play a role in spreading risk. Therefore, subscription and service revenue can also be significantly affected when trading activity is sluggish or market prices fall.
For example, in the third quarter of 2024, Coinbase’s blockchain reward revenue fell 16%, due to falling ETH and SOL prices.
Through Kaiko’s blockchain monitoring tool, it can be found that net traffic on the Ethereum beacon chain declined in the fourth quarter of 2024. As the second-largest ETH pledge entity after Lido, Coinbase is one of the main contributors to this downward trend. Data shows that in the past six months, Coinbase’s share of the pledge market has dropped by 3.8%, with a net outflow of 1.29 million ETH units during the same period.
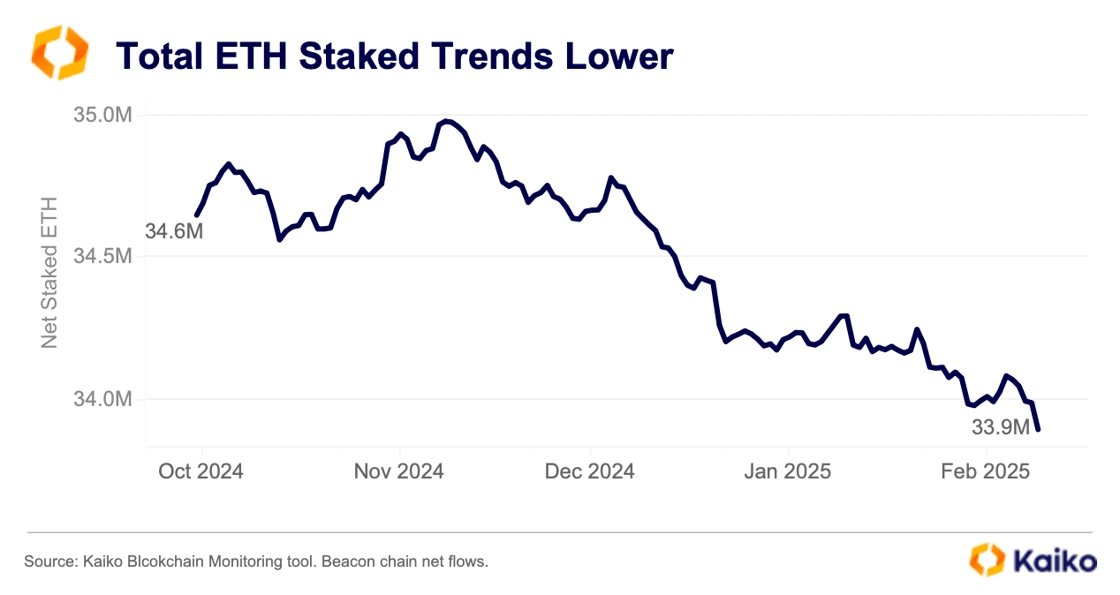
This trend suggests that although Coinbase still occupies an important position in the pledge space, its market share is gradually being eroded by other competitors. This may have an adverse impact on its long-term revenue growth and competitiveness.
Although price increases in ETH and SOL during the quarter somewhat alleviated the impact of the reduction in pledges, overall data still showed that Coinbase’s blockchain reward revenue may decline in the fourth quarter. Especially in the ETH pledge market, Coinbase’s market share fell by 3.8%, which had a direct impact on its pledge-related revenue.
Coinbase’s commercial agreement with Circle allows it to obtain a stable source of revenue from USDC-related revenue. It is worth noting that Circle’s new partnership with Binance and record USDC transaction volume may have partially offset the impact of the decline in pledge revenue. This provides Coinbase with an additional revenue cushion, especially as pledge and trading revenue are under pressure.
Retail traders, as the users paying the highest transaction fees, their share of transaction volume has dropped significantly from 40% in 2021 to 18% currently. Although Coinbase’s subscription business, such as blockchain rewards and custody services, has grown, the loss of retail traders has put significant pressure on its trading revenue.
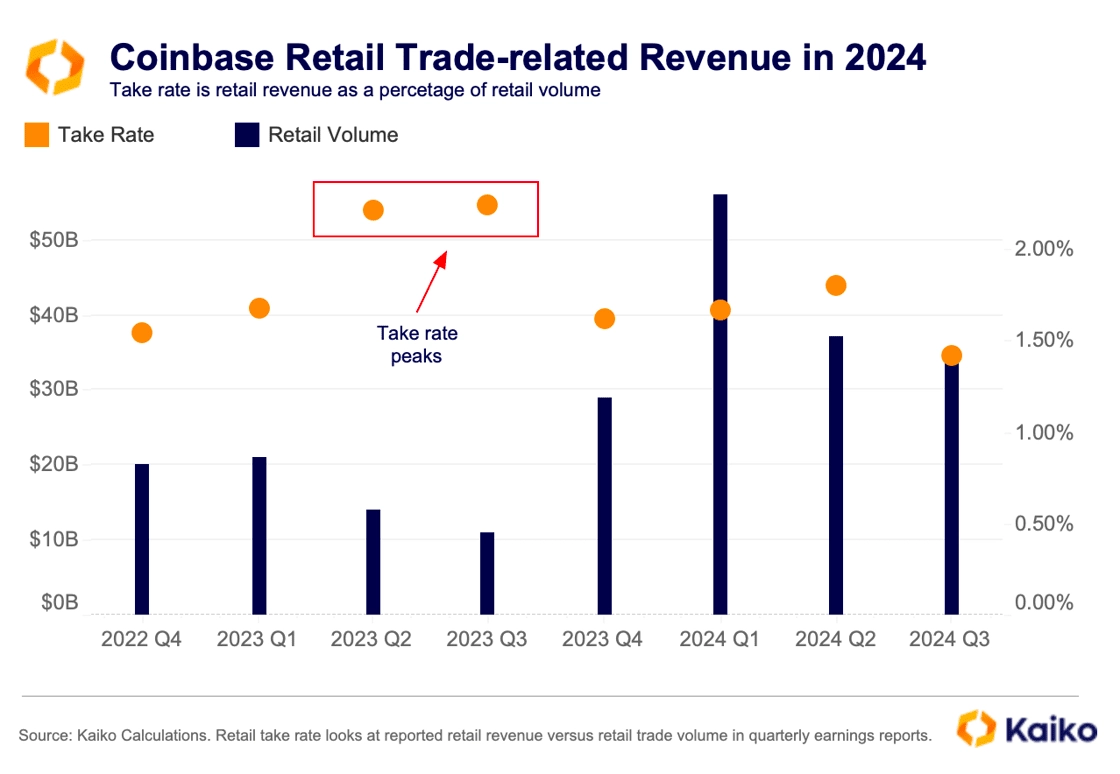
Since peaking in mid-2023, Coinbase’s withdrawal rate, or the proportion of revenue it receives from retail traders, has dropped to its lowest level since the Terra Luna crash in the first half of 2022.
The decline in revenue comes amid intensified competition in the U.S. market, with some platforms seeking to attract users by significantly reducing transaction fees, further exacerbating pressure on platforms such as Coinbase.
Although Coinbase remains one of the most liquid exchanges in the United States, with a relatively stable fee structure, which favours market makers rather than order-takers, the decline in retail traders has undoubtedly increased the pressure on this source of revenue.

In addition, although Coinbase continues to enrich its product categories and gain more benefits in terms of cross-product synergies, its new asset listings have slowed significantly due to the strict regulatory environment in the United States.
The chart below shows that since the SEC filed a lawsuit against Binance.US and Coinbase in June 2023, the number of active trading pairs on both platforms has dropped significantly. However, if the regulatory environment improves in the future, Coinbase may re-accelerate the pace of listing, which may also increase its appeal to retail traders.
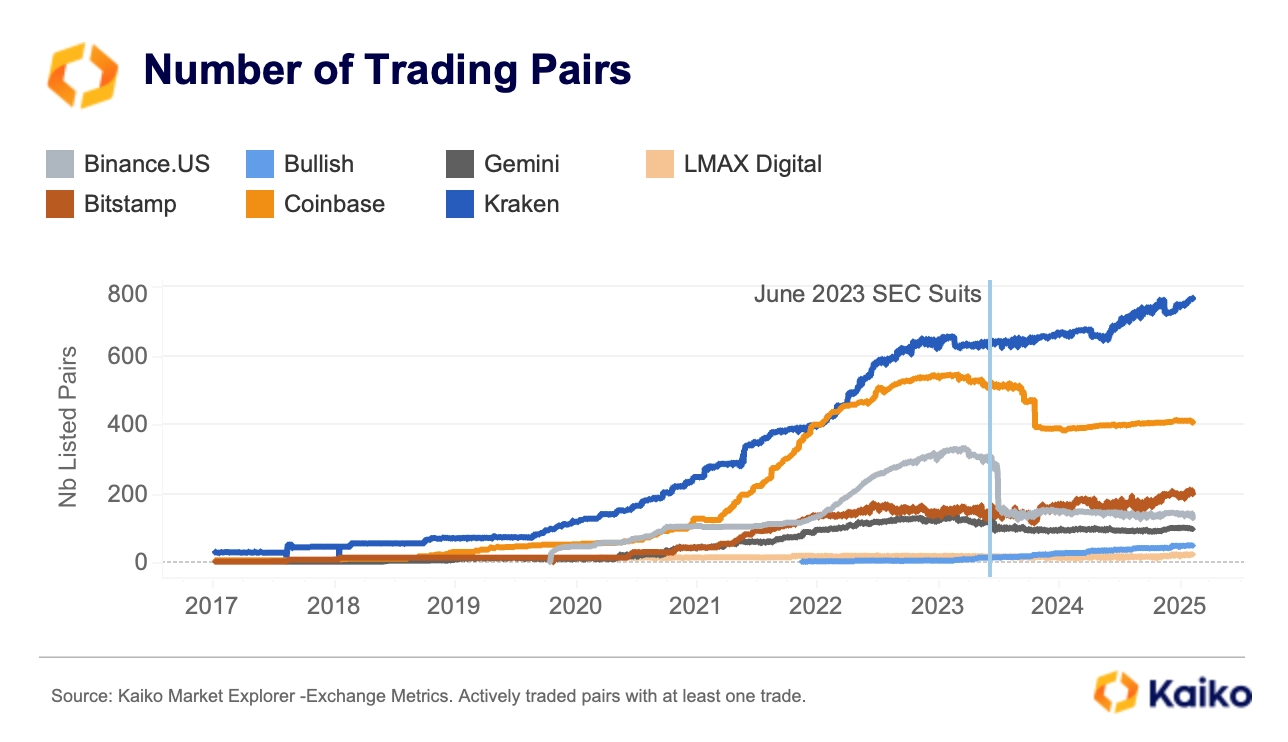
data points
USDC trading volume hits record high: Binance’s dominance
Binance has now become the world’s largest USDC trading market, with weekly trading volume reaching US$24 billion in January 2025, accounting for 49% of the total global USDC trading volume. This is the highest market share since September 2022. This significant increase is due to Binance’s strategic cooperation agreement with Circle in late 2024, which aims to drive wider adoption of USDC.
In contrast, Bybit’s market share has dropped significantly, from 38% in October 2023 to the current 8%.
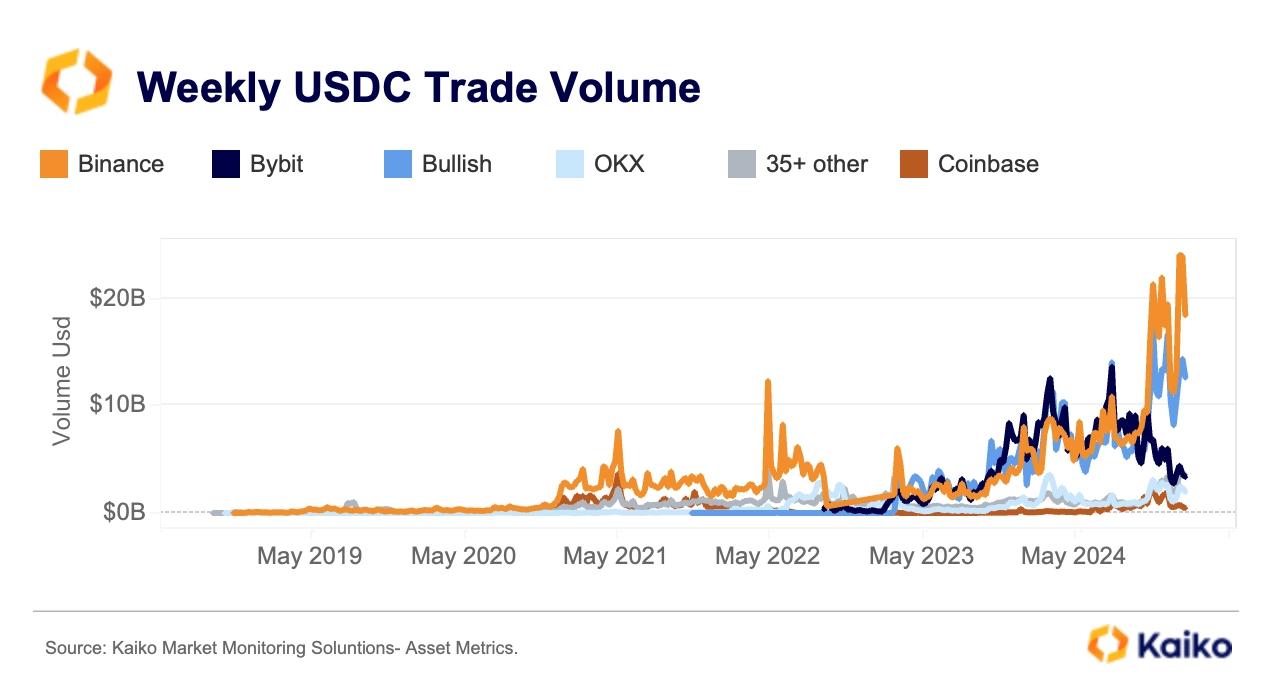
At the same time, the Bullish platform rose rapidly and became one of Binance’s main competitors with a market share of 32%.
This change in the market pattern is also reflected in the intensified competition among stablecoins. Data shows that the proportion of newly launched USDT quote trading pairs has dropped from 77% in 2023 to below 63% in 2024, and so far in 2025, this proportion has further dropped to 50%.
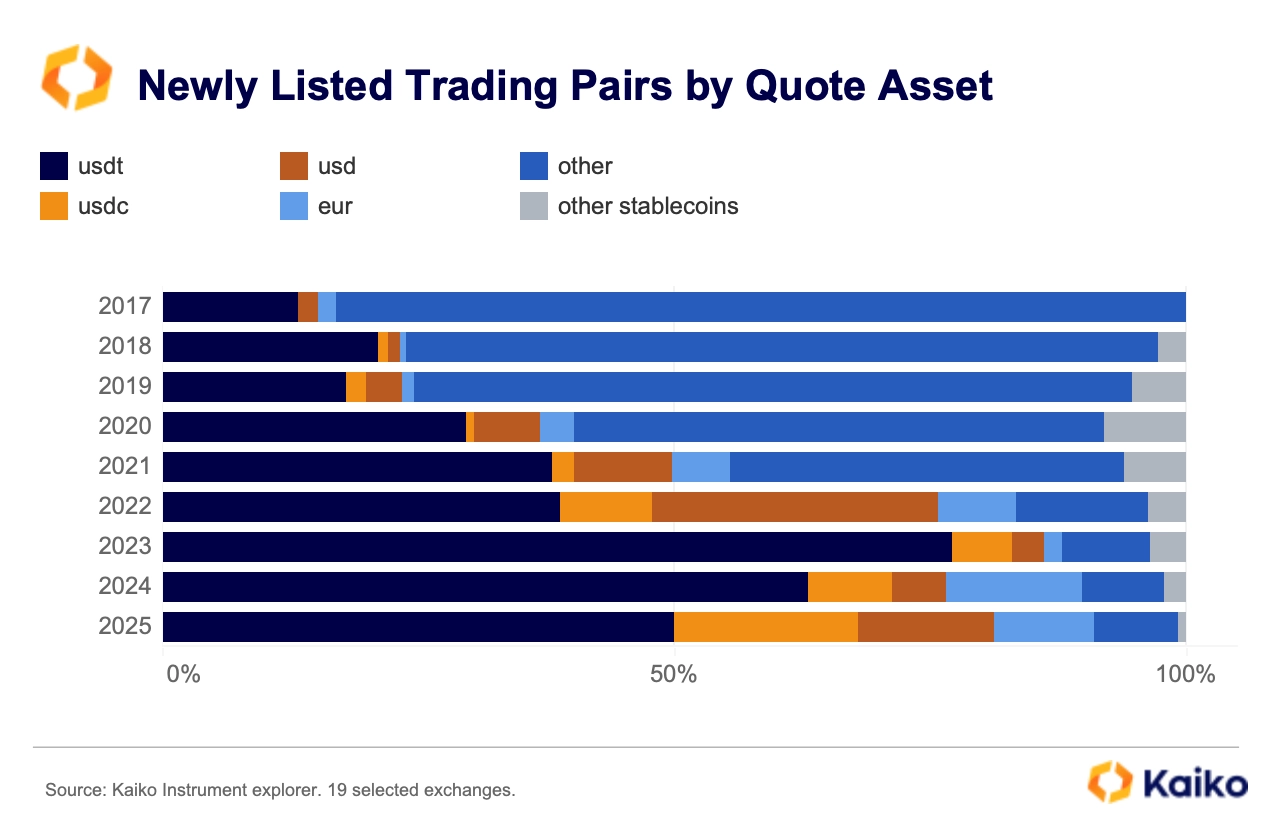
It is worth noting that euro-backed trading pairs are gradually attracting market attention. This may indicate that the EU market is experiencing a recovery with the implementation of the 2024 MiCA regulation. For a more detailed analysis of euro market trends, please refer to our latest research report.
Shanzhai liquidity: centralization trend and the rise of small Tokens
Since the U.S. election, the market’s outlook and sentiment towards altcoins have improved significantly. This positive sentiment has driven a large number of new altcoin ETF applications, while also driving a surge in trading activity.
Data shows that the daily altcoin liquidity indicator (measured by a market depth of 1% of the top 50 Tokens) has almost doubled since September 2023 to US$960 million.
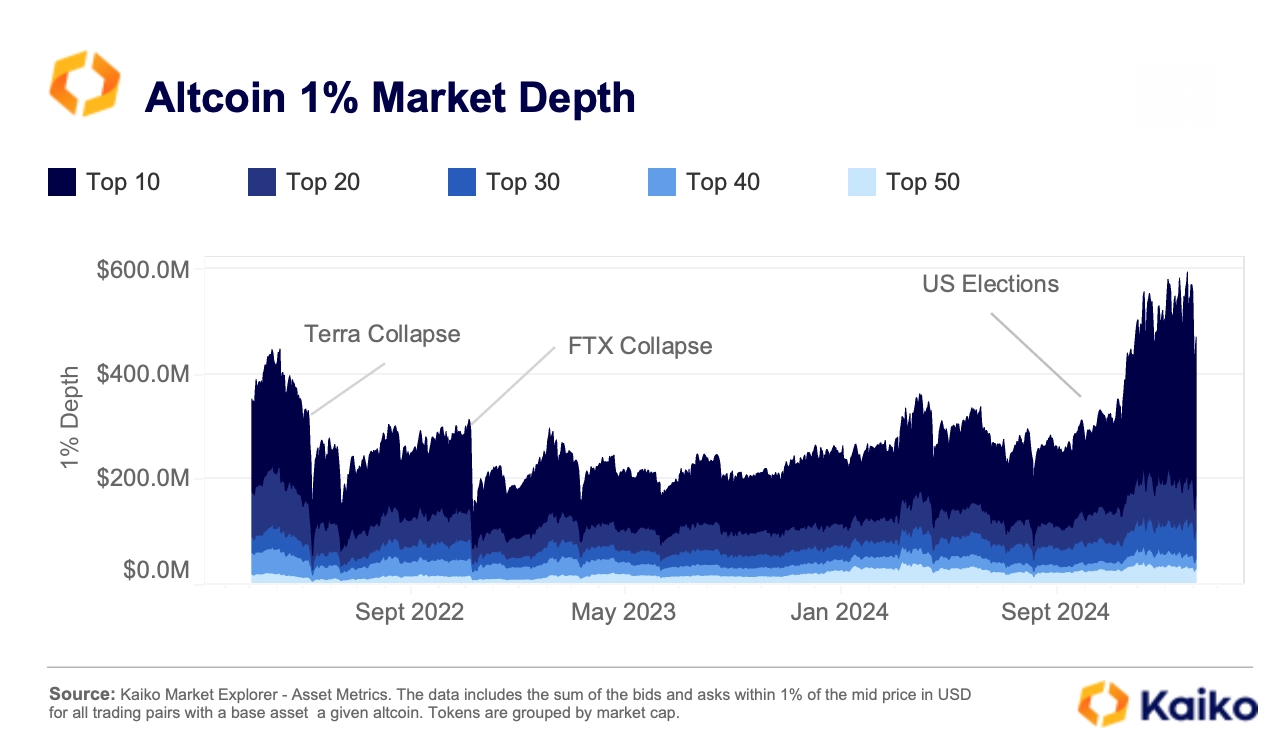
However, liquidity distribution is uneven and is still highly concentrated among the top 10 copycats, with these Tokens accounting for 64% of the total market depth. In contrast, the liquidity share of mid-market cap Tokens (ranked 20 – 30) declined, while the liquidity share of small-market cap Tokens (ranked 50) showed surprising growth, and its liquidity share even exceeded that of the higher-market cap group (ranked 40).
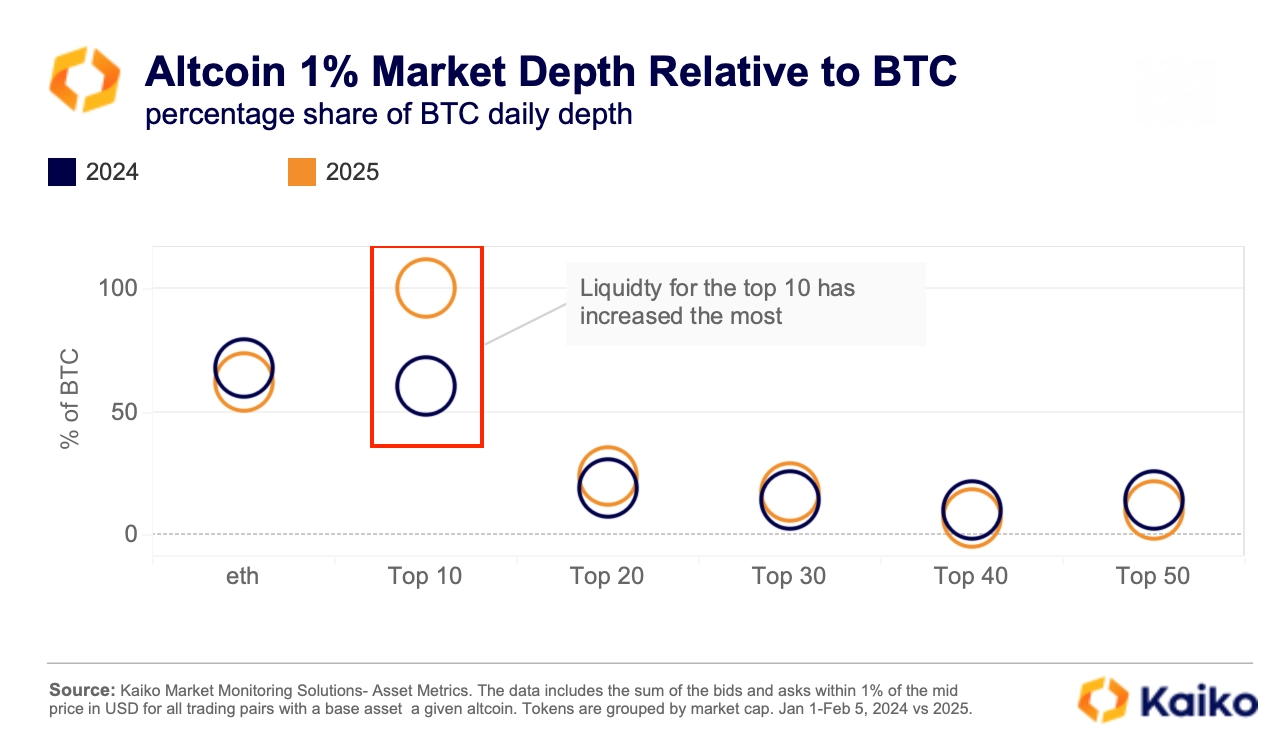
However, market liquidity remains highly concentrated, with the top 10 shanzhai companies accounting for 64% of the total market depth. In contrast, the market share of mid-cap tokens (ranked 20 – 30) decreased, while the market share of small cap tokens (ranked top 50) unexpectedly increased, and their liquidity share even exceeded that of the higher-cap token group (ranked top 40).
Welcome to join the official social community of Shenchao TechFlow
Telegram subscription group: www.gushiio.com/TechFlowDaily
Official Twitter account: www.gushiio.com/TechFlowPost
Twitter英文账号:https://www.gushiio.com/DeFlow_Intern


