Original title: “Eve of the Storm? Bitcoin surprises the “cross star”, and the tug of war between long and short is pending ”
Original source: BitpushNews
Recently, the market has been in a tug-of-war. BTC long and short sides have repeatedly gambled between US$100,000 and US$96,000. In the past week, there has been a significant backstep, once falling below the support level of US$91,000. It can be seen from the volatility that investors ‘anxiety about short-term trends is heating up.
Long-term holder movements and market signals
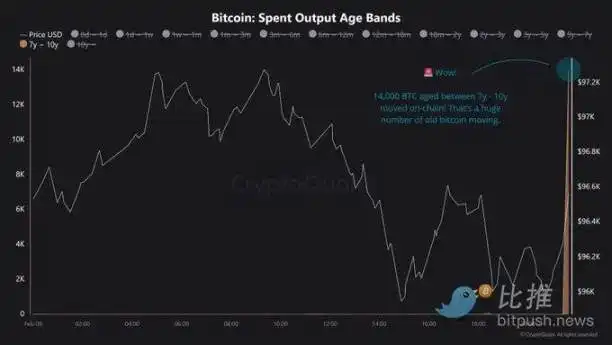
On February 9, well-known analyst Maartunn shared a set of on-chain data: 14,000 bitcoins with a history of 7 to 10 years had moved on the chain.

This long-dormant bitcoin’s return to circulation is often seen as an important signal, and these actions may indicate multiple motivations-long-term holders may be preparing for potential gains, institutions may be relocating, or market participants are worried about continued selling pressure. In any case, the reactivation of such a large number of old bitcoins usually signals the imminent sharp price fluctuations. Although such actions are not uncommon during market consolidation, they add even more uncertainty to current market sentiment.
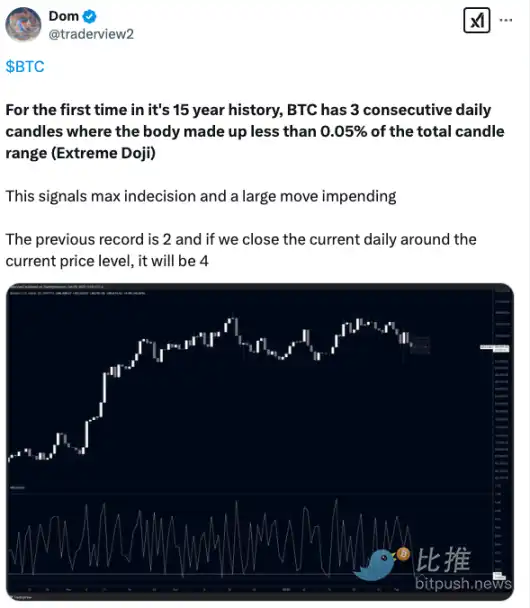
In addition, analyst DOM found an unprecedented “cross star” pattern (Doji) on Bitcoin’s daily chart, which often signals market uncertainty, similar to the trend after the FTX crash in November 2022.
DOM said: “For the first time in Bitcoin’s 15-year history, three consecutive ‘Extreme Cross Star’ candle diagrams have appeared, and the physical part of each candle only accounts for less than 0.05% of the entire candle range. This is a sign of extreme hesitation in the market and a sign of significant volatility on the horizon.”

It is worth noting that in November 2022, Bitcoin had two consecutive “extreme cross star” candle charts, and the price rebounded by 620%. If history repeats itself, Bitcoin could be on the verge of another round of explosive price movements.
Key price levels and technical analysis
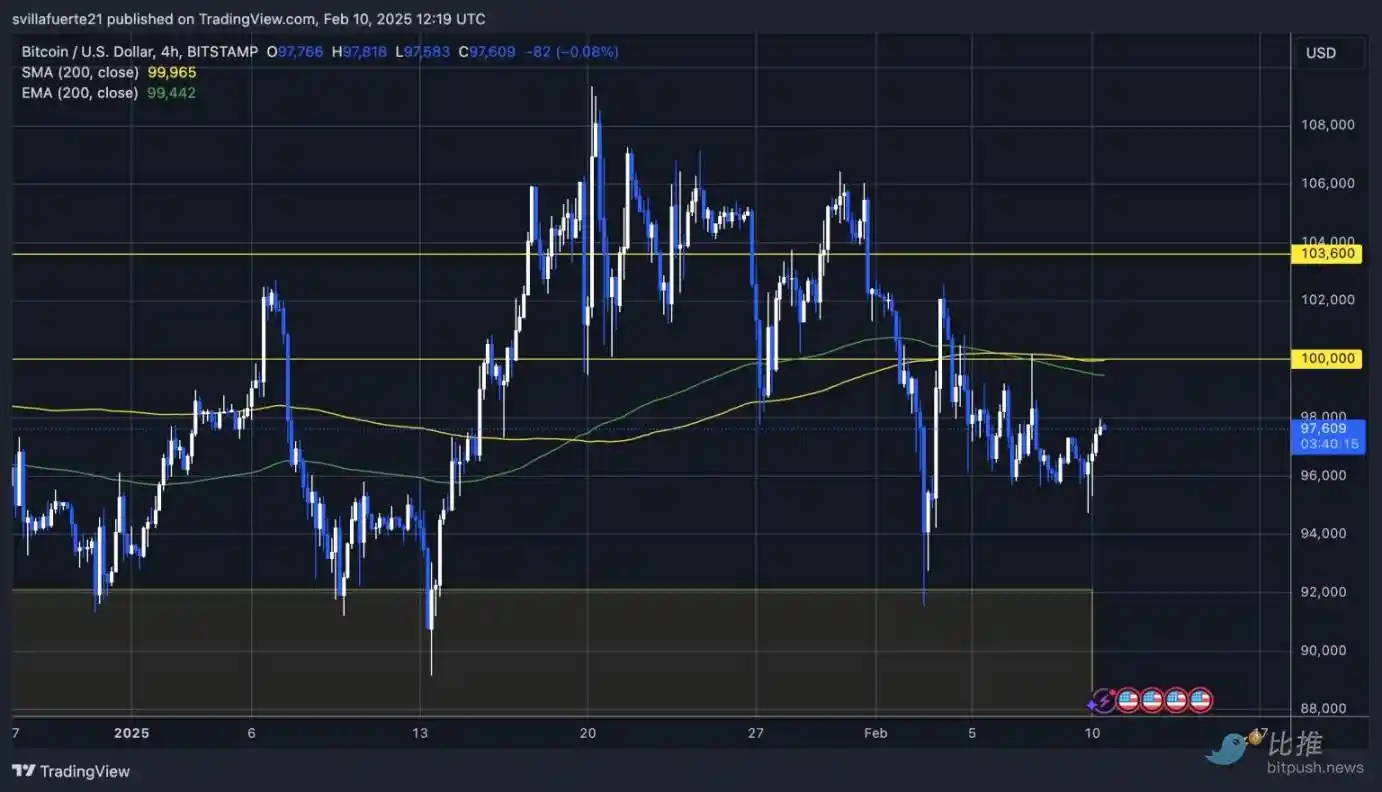
TradingView data shows that Bitcoin’s current price is hovering around US$97,600. Analyst Sebastian believes that to reignite the bullish momentum, Bitcoin first needs to stabilize at the key level of US$98,000, which will lay the foundation for breaking the psychological barrier of US$100,000. Once Bitcoin successfully breaks through and stands firm at the US$100,000 mark, it will confirm the strong return of long momentum and is expected to further explore a higher supply range and start a new round of rising prices.

However, the current demand range of $96,000 to $97,000 must be held to provide support for potential gains. If this range is lost, it may trigger more selling pressure. In this case, Bitcoin could fall below $95,000 and then drop into the demand range near $90,000. Such a trend will severely impact market sentiment and further strengthen bearish expectations.
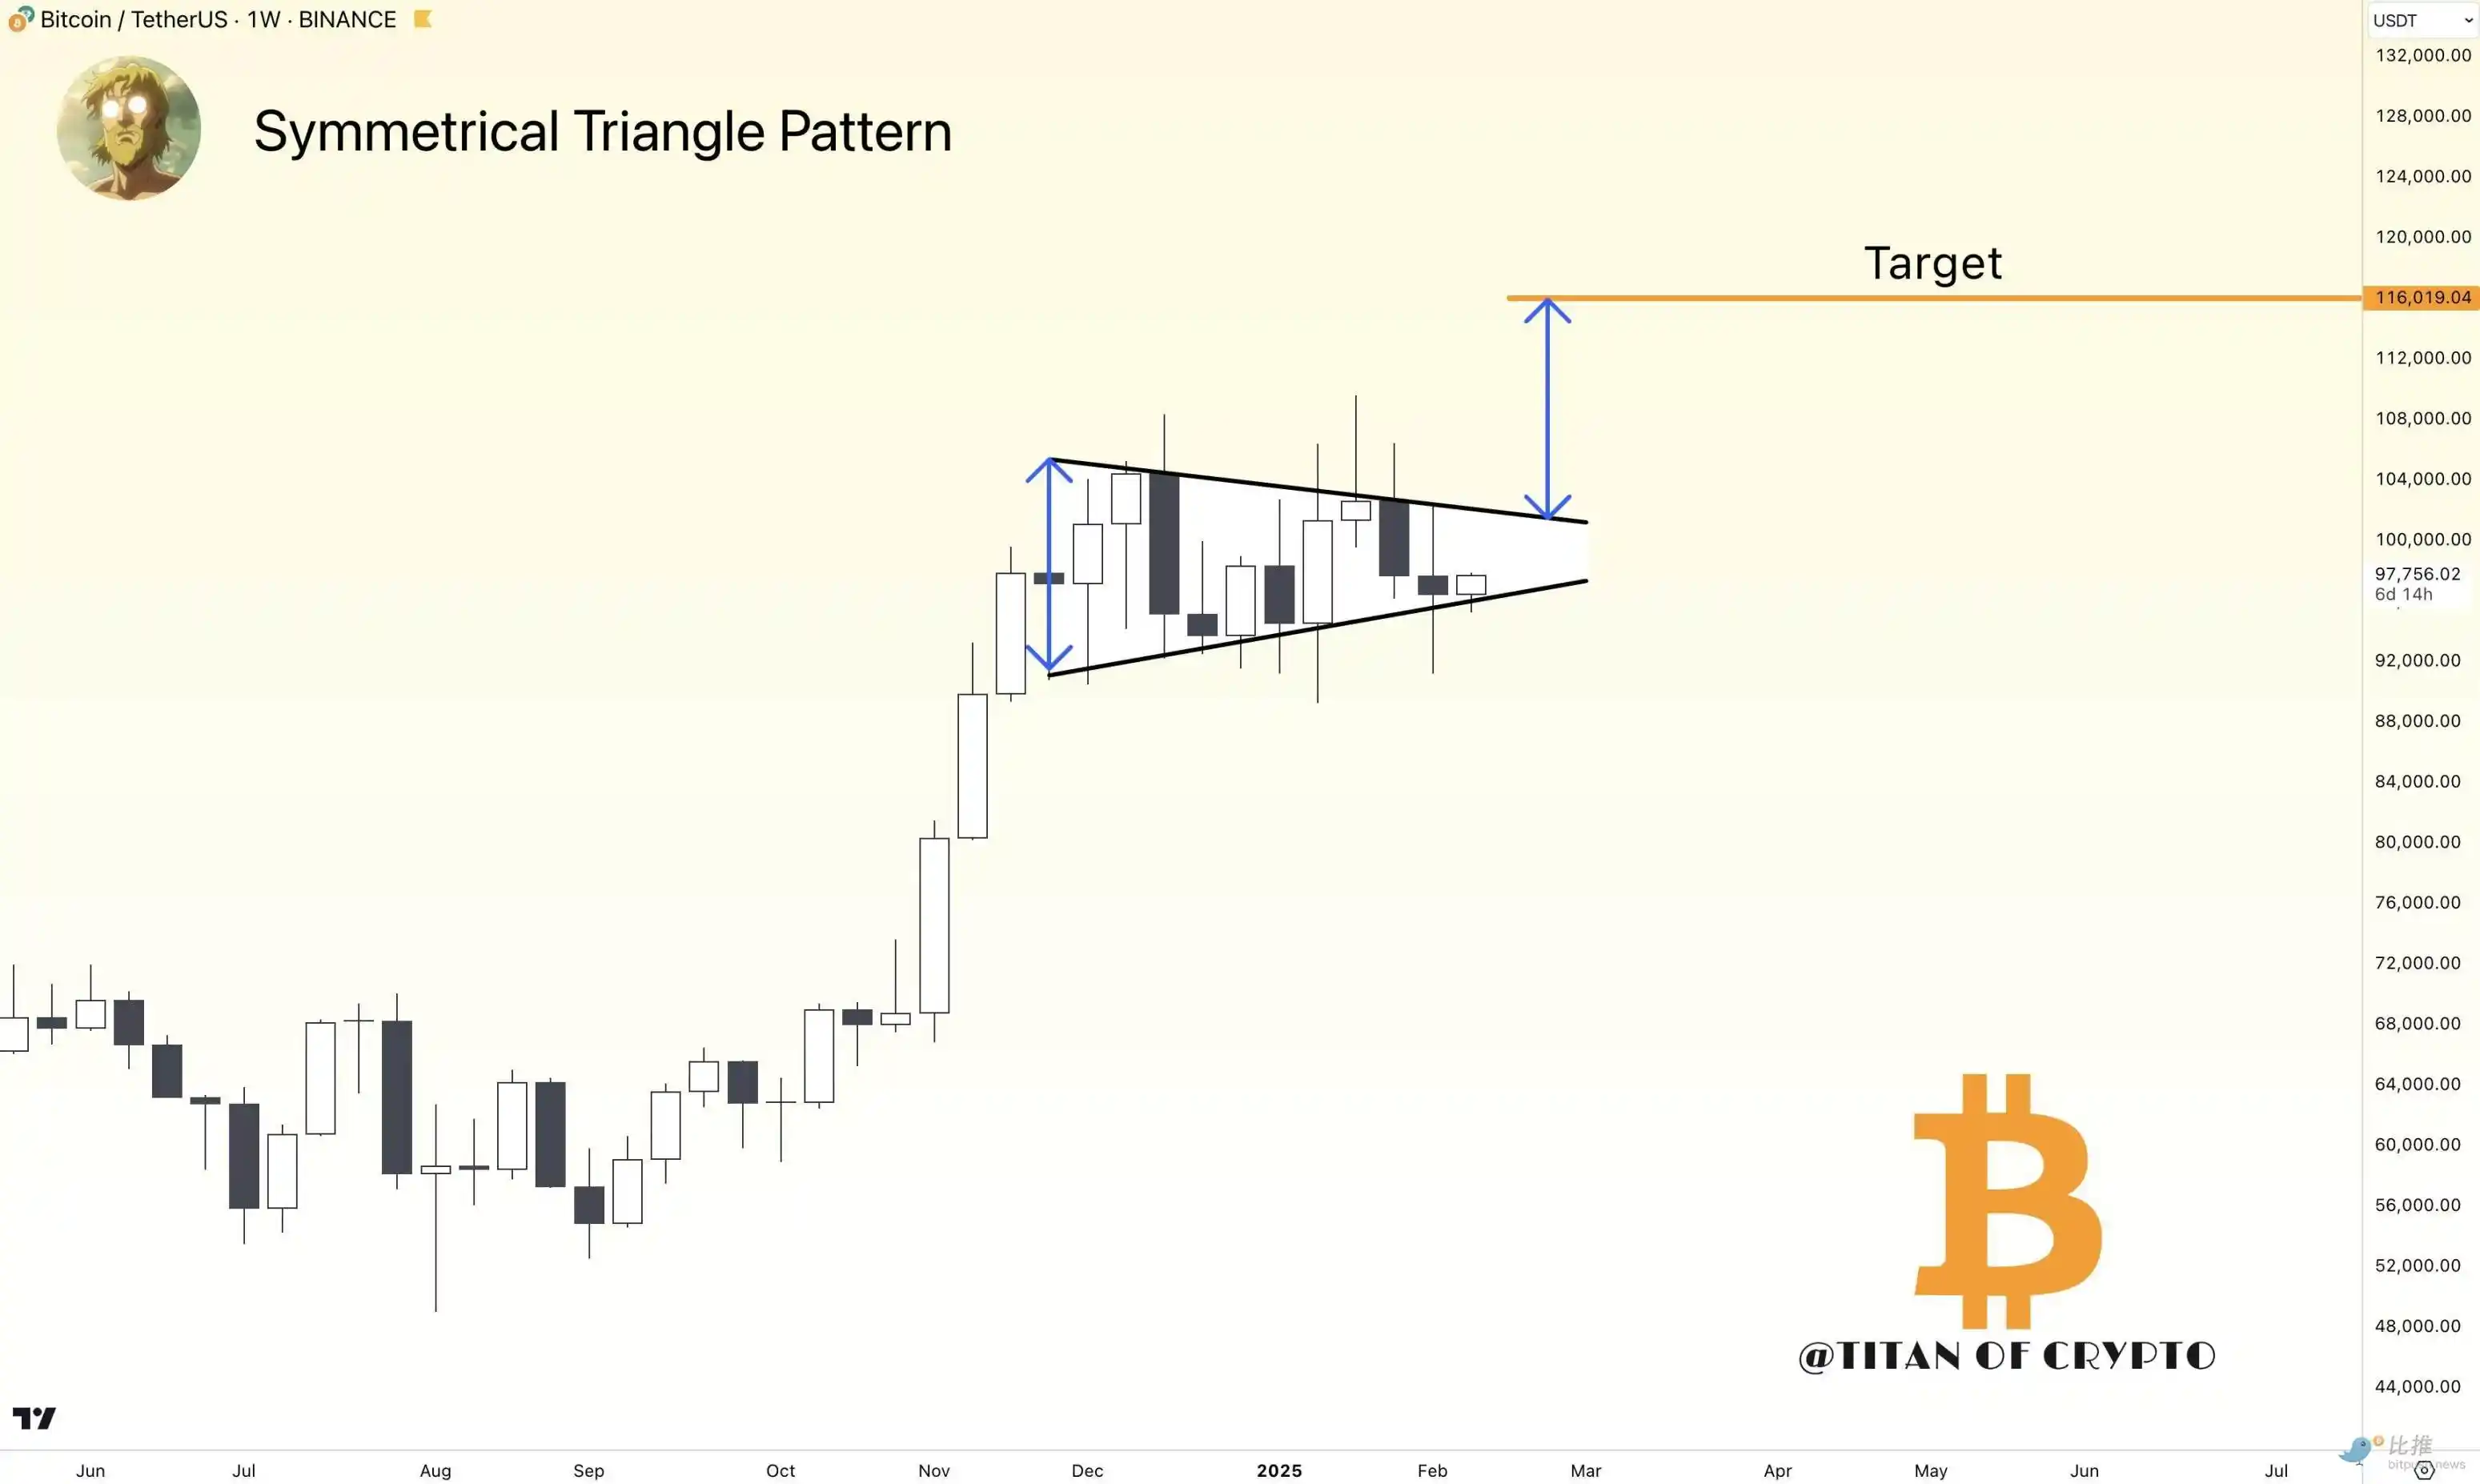
Bitcoin has also recently formed a symmetrical triangle, a technical form that often heralds a major price breakthrough.
Market analyst Titan of Crypto pointed out that Bitcoin prices are expected to break through the triangular uptrend line and eventually reach the target of $116,000. According to the rules of technical analysis, the upward target is calculated by adding the maximum distance between the upper and lower trend lines of the triangle to the potential breakthrough point. This method provides a theoretical basis for Bitcoin’s upward target.

Zach Pandl, research director at Grayscale, predicts that with the support of Trump’s favorable policies, Bitcoin may hit a record high in the first quarter of 2025. Despite this,$80,000 remains a popular target for many analysts in the short term. Investment research firm Bravo Research points out that if prices fall back to this level, it will provide traders with an opportunity to “buy on dips.”
To sum up, Bitcoin is currently at a critical technical juncture, and the balance of power between the long and short sides will determine the market trend in the short term. Investors need to pay close attention to the performance of the two key levels of $98,000 and $96,000. Breakthroughs in either side may trigger sharp market fluctuations.
original link


